
Product-Level P&L: The Margin Leak No Dashboard Will Show You
At a recent retail panel, I was asked a practical question: if a retailer had one month to implement one AI workflow, where should they start?
My answer was product-level P&L.
Not another content generator. Not a chatbot. Not another dashboard.
The retailer should first be able to see the economics of every product, on every channel, quickly enough to make a decision about it.
That sounds like ordinary reporting. It is not.
In one e-commerce operation we worked with, the obvious products were already obvious. The team knew its winners. It knew when a hero SKU was running out of stock. It knew which campaigns consumed the largest budgets.
The blind spot was the rest of the catalogue: close to 900 SKUs competing for finite attention. Some were moving slowly. Some generated sales but weak profit. Some remained in production or replenishment because nobody had enough evidence to stop them. Individually, each product looked too small to investigate. Together, they represented a meaningful operating problem.
The value was not finding the products everybody already watched. It was making the unattended long tail economically visible.
What product-level P&L means
A company P&L answers whether the business made money.
A channel P&L may answer whether a marketplace, retail store or direct website made money.
A product-level contribution P&L asks a more operational question:
After the costs we can directly attribute, how much did this SKU contribute on this channel this week?
The basic equation is:
Net revenue
− Landed product cost
− Marketplace and payment fees
− Fulfilment and shipping costs
− Returns and handling costs
− Attributable advertising and KOL spend
= Contribution profit
This is deliberately called a contribution P&L. It does not pretend that rent, management salaries and every corporate overhead can be assigned precisely to one unit of one product. It captures the economics that operators can observe and change.
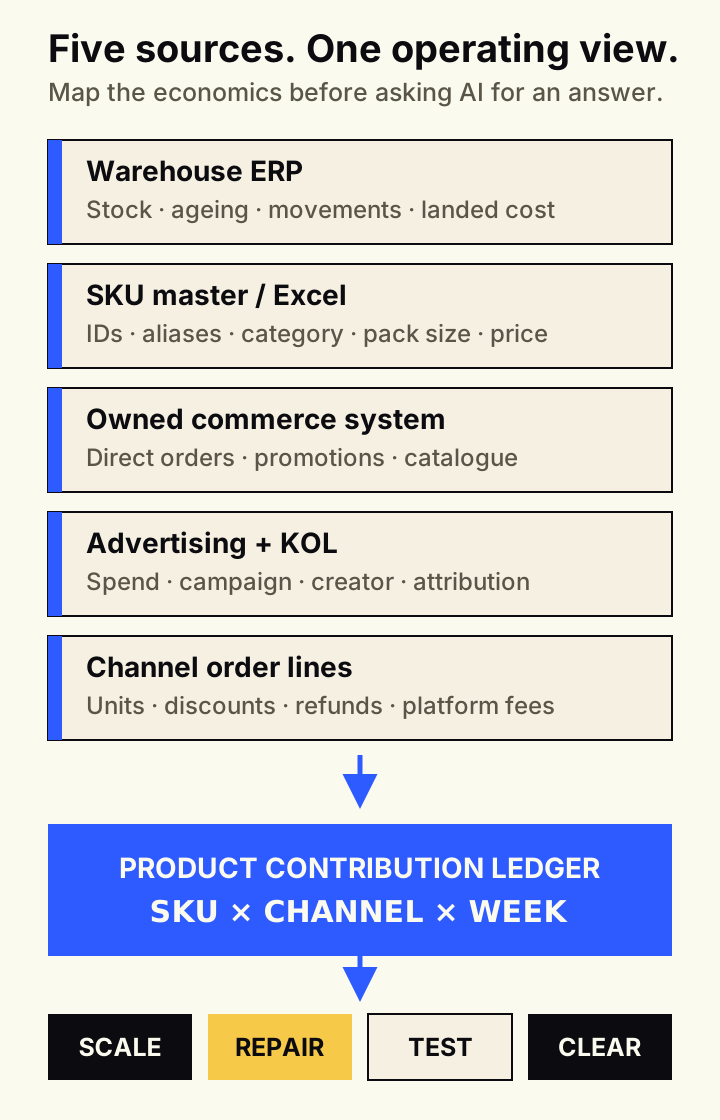
The useful unit of analysis is not a dashboard or a file. It is SKU × channel × week.
The mathematics behind a misleading sale
Revenue is not contribution.
Consider an illustrative product that records RM100 of gross sales. After RM12 of discounts and refunds, net revenue is RM88. Then come RM38 of landed product cost, RM10 of channel and payment fees, RM8 of fulfilment, RM26 of attributed advertising and KOL spend, and RM9 of return handling.
The arithmetic is simple:
RM100 − RM12 − RM38 − RM10 − RM8 − RM26 − RM9 = −RM3
The product produced sales. It also lost RM3 before corporate overhead.
Its contribution margin is:
−RM3 ÷ RM88 net revenue = −3.4%
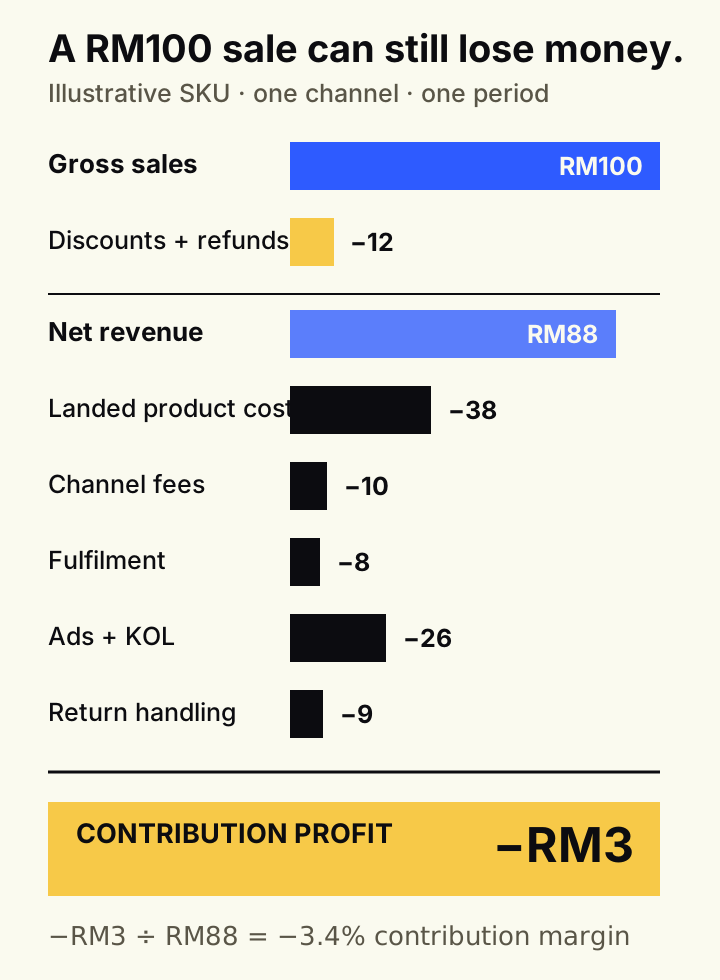
Illustrative numbers, simplified to show the calculation. They are not client results.
Now add inventory. If 480 aged units remain in the warehouse at a landed cost of RM38 each, the capital exposure is:
480 units × RM38 = RM18,240 tied up in stock
If the product sells only 20 units per week, its weeks of cover are:
480 units ÷ 20 units per week = 24 weeks of cover
That does not automatically mean “clear it tomorrow.” It does mean the product deserves a decision. Seasonality, replenishment lead time, shelf life and strategic range all matter. The calculation tells the team where to look.
Start wide, not small
This is not a useful exercise for 10 or 20 hand-picked products. That would repeat the same attention bias the system is supposed to solve: the team would choose the products it already notices.
The minimum useful scope is the full active catalogue, or at least 100 SKUs. Simplify the depth of the first analysis, not its coverage.
For a first pass, use the latest four to eight weeks and calculate only:
- Net revenue
- Contribution profit and contribution margin
- Sales velocity
- Weeks of inventory cover
- Data confidence: complete, incomplete or unknown
The system should screen every SKU, then surface the 10 to 20 products that most urgently require human attention. That is the leverage: people investigate the exceptions while the system watches the catalogue.
You do not need a human to examine every product. You need the system to examine every product before deciding where humans should look.
Five systems had pieces of the answer
The client did not lack data. The data lived in systems built for different jobs:
| Source | What we needed from it |
|---|---|
| Warehouse ERP | Stock on hand, receipts, movements, ageing and landed cost |
| SKU master maintained in Excel | Product IDs, aliases, category, pack size, standard cost and selling price |
| Owned commerce system | Direct orders, promotions, product catalogue and customer-facing price |
| Advertising and KOL records | Spend, campaign references, creator cost and attributable orders |
| Sales orders by distribution channel | Order lines, units, gross sales, discounts, refunds and channel fees |
Connecting APIs was only part of the work. The same product could have a different identifier in the warehouse, marketplace, advertising account and finance spreadsheet. Bundles complicated unit cost. Refunds arrived after the original sale. Advertising was sometimes attributable to a SKU and sometimes only to a campaign or category.
A reliable model therefore needs three explicit layers:
- Mapping: resolve SKU aliases, bundles, channels, currencies and dates.
- Economics: calculate revenue and attributable costs using controlled formulas.
- Interpretation: flag exceptions and explain what changed in language an operator can act on.
AI is useful in the first and third layers. It can help map messy descriptions, classify exceptions, investigate anomalies and explain a result. The financial arithmetic in the middle should remain deterministic, documented and testable.
AI does not make the mathematics true. Connected data and controlled definitions do. AI makes the operating surface reviewable at a cadence humans can sustain.
From a number to a decision
Once contribution margin and sales velocity are visible together, every SKU can be routed into a useful conversation.
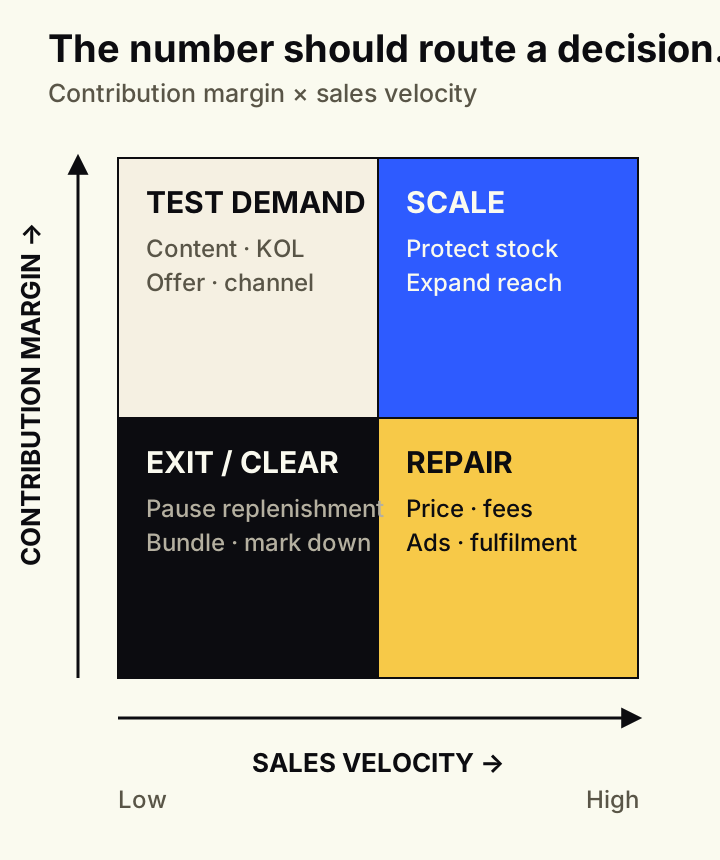
The four quadrants imply different actions:
- High contribution, high velocity: Scale. Protect availability, review replenishment and consider increasing distribution or acquisition.
- Low contribution, high velocity: Repair the economics. Test price, discount depth, platform mix, fees, fulfilment or acquisition cost. Popularity is not enough.
- High contribution, low velocity: Test demand. Change content, KOL, offer, merchandising or channel while protecting the product's margin.
- Low contribution, low velocity: Exit or clear. Pause replenishment, bundle, mark down, move channels or discontinue after an appropriate test window.
There should also be a fifth classification: Unknown. If landed cost, returns or channel fees are missing, the system should not quietly manufacture a margin. Missing economics is itself an operating finding.
The weekly SKU control loop
A one-off product report becomes stale immediately. The useful system is a weekly operating loop.
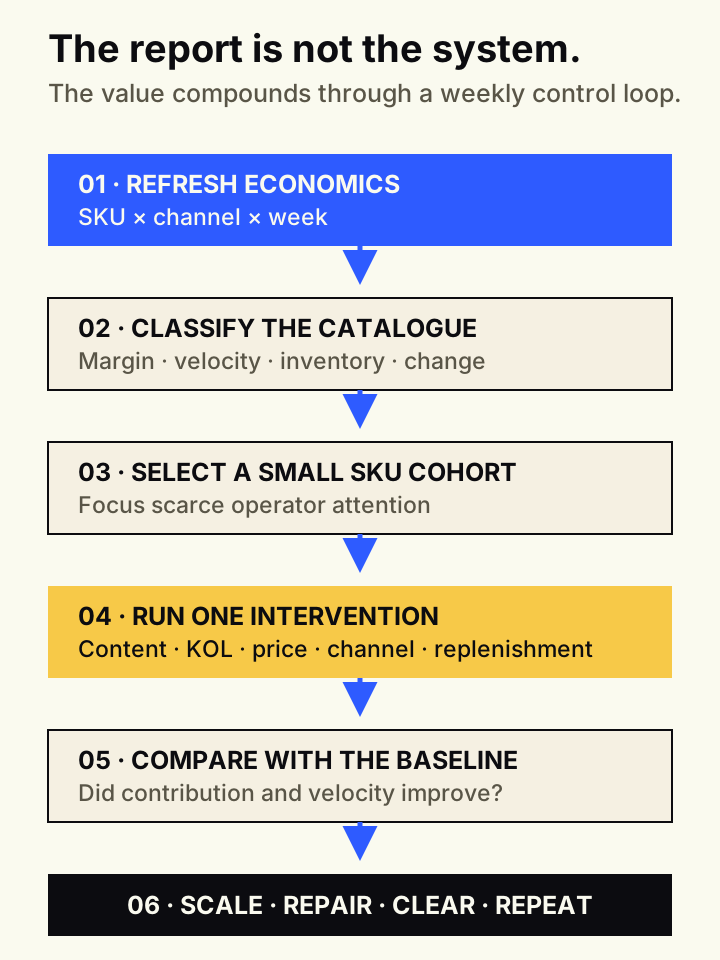
The team does not need to change 900 products at once. It needs a repeatable way to select the next few products deserving attention.
A practical cadence looks like this:
- Refresh the SKU × channel × week ledger.
- Rank products by contribution, velocity, inventory exposure and change from the prior period.
- Select a small cohort for intervention.
- Change one primary variable: content, KOL, price, promotion, channel or replenishment.
- Compare the next period against the baseline.
- Scale what improved, repair what remains fixable, and route persistent failures into clearance or discontinuation.
Different categories need different test windows. A fashion launch, staple food product and seasonal gift should not share one universal four-week rule. The system should encode the operating context rather than hide it.
Why the dashboard is too far away
A dashboard might show that margin fell or inventory ageing increased. The operator still has to decide which product deserves attention and what to do next.
A decision-ready output is closer to this:
This SKU sold 184 units on Channel B last week but produced negative contribution after a deeper discount and higher acquisition cost. Inventory cover is 17 weeks. Pause replenishment, restore the previous price for one week, and test a new creator cohort before considering clearance.
That statement contains a target, a diagnosis, a proposed intervention and a review window. It can be challenged. It can be assigned. It can be measured.
We have written before about why dashboards can make teams slower. Product-level P&L is one concrete example of closing that interpretation gap. The purpose is not to remove human judgement. It is to move the evidence close enough to the operator that judgement can happen every week.
A prompt to start the analysis
A prompt cannot compensate for missing economics, but it can help a team inspect the data it already has. Remove personal customer information before uploading any files.
Act as a retail profitability analyst.

Inspect the uploaded order-line, SKU cost, inventory, advertising,
channel-fee, fulfilment and returns files. Do not calculate yet.

First:
1. List the available fields and date coverage in every file.
2. Identify SKU, channel and date keys that can be joined.
3. Report duplicates, inconsistent identifiers and missing costs.
4. Never invent or silently impute a financial value.

Then build a SKU × channel × week contribution view using documented formulas.
For each row, show net revenue, landed product cost, fees, fulfilment,
returns, attributable acquisition cost, contribution profit,
contribution margin, units sold, stock on hand and weeks of cover.

Classify each SKU as Scale, Repair economics, Test demand, Exit/clear
or Unknown. Explain the evidence for each classification and recommend
one measurable intervention for the next review period.
The first useful output is not a beautiful chart. It is a ranked view of the full catalogue, a list of missing definitions, and the 10 to 20 products most worth discussing with the team.
The question to ask now
Do not begin with: “How can we use AI in retail?”
Begin with:
Which decision do we need to make, and where are the economics required to make it?
For a retailer carrying hundreds of products across multiple channels, product-level contribution P&L is often a strong first answer.
For what the first join surfaced at one apparel brand, including the restock nobody had seen coming, read the case companion to this post.
If your data exists but your team still cannot identify which products to scale, repair or stop, that gap is exactly what our AI Operations Audit is designed to map.